AgroBh — Farm Management System
Full-stack web application for agricultural production management
About the project
AgroBh is a modern production-ready full-stack web application for agricultural production management. The system supports multi-farm and multi-crop architecture, initially focused on strawberry production but designed to handle any crop type. It covers the complete production cycle — from parcel mapping and planting through harvest tracking and packaging to cost analysis, invoicing, and profitability reports.
Challenge
Agricultural producers needed a comprehensive digital tool to manage the full complexity of modern farming operations. Traditional methods of tracking parcels, harvests, costs, and inventory using spreadsheets and paper records were error-prone and time-consuming. The system had to handle multi-farm operations, provide real-time monitoring of fertigation parameters, ensure full traceability through LOT codes, and deliver actionable insights through dashboards and reports — all while being intuitive enough for non-technical farm workers.
Solution
We developed a complete full-stack SaaS application with 15+ functional modules covering every aspect of farm management. The platform features interactive Google Maps integration for parcel management, class-based harvest recording with LOT traceability, comprehensive cost and profitability analysis, pH/EC monitoring with alarms, inventory management with alerts, CRM with invoice generation, and a central dashboard with real-time farm overview and CSV exports.
Detailed overview of all features
A complete list of everything designed, developed, and implemented on this project.
Interactive Parcel Map
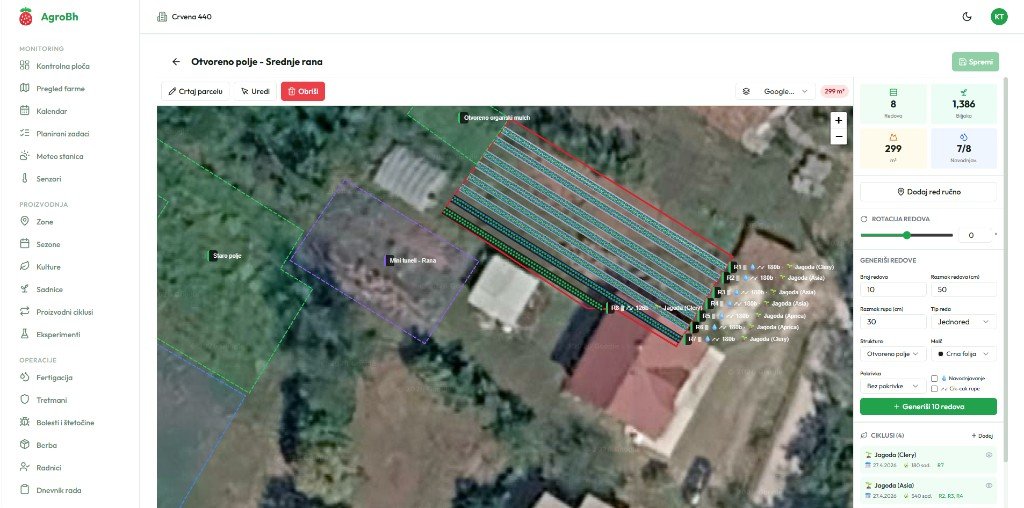
Google Maps-based parcel management with satellite imagery and advanced drawing tools.
Google Maps satellite view
Full satellite imagery integration allowing farmers to see actual terrain, identify parcels, and plan operations based on real-world geography.
Drawing and editing parcels
Interactive polygon drawing tools to define parcel boundaries directly on the map, with editing capabilities for boundary adjustments.
Automatic row generation
System automatically generates planting rows within defined parcels based on spacing parameters and crop type configuration.
Cycle visualization
Visual representation of crop cycles on the map — color-coded parcels showing planting, growth, harvest, and dormancy stages.
Row rotation
Support for row rotation planning across seasons, helping optimize soil health and prevent crop-specific disease buildup.
Harvest and Packaging
Complete harvest recording system with quality classification and full traceability.
Class-based harvest records
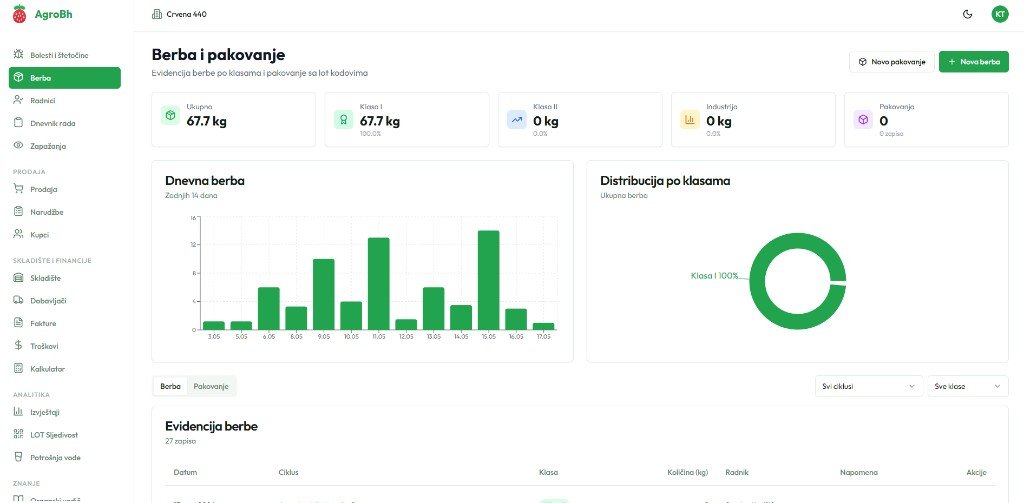
Harvest entries categorized by quality class — Class I, Class II, industrial — with weight, date, parcel, and worker attribution.
Lot codes for traceability
Automatic LOT code generation for every harvest batch enabling full farm-to-table traceability as required by food safety regulations.
Dashboard with charts
Visual harvest dashboard with bar charts, trend lines, and summary statistics showing daily, weekly, and seasonal harvest performance.
Filtering
Advanced filtering by date range, parcel, crop, quality class, and worker — enabling quick access to specific harvest data.
Tab navigation
Organized interface with tab-based navigation between harvest entry, history, packaging records, and analytics views.
Costs and Profitability
Financial management module with visual analytics and profitability insights.
Category donut chart
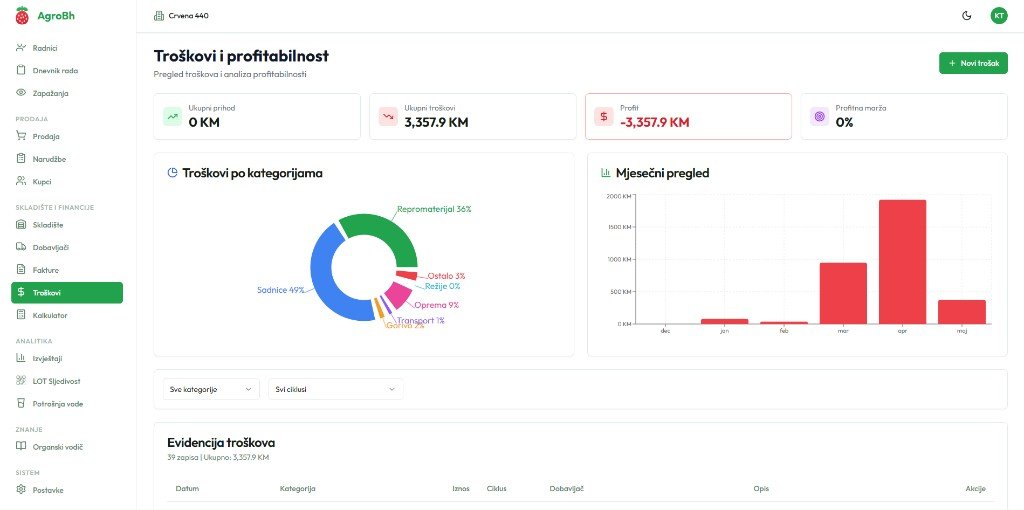
Interactive donut chart breaking down expenses by category — labor, materials, equipment, fertilizers, plant protection — for instant cost overview.
Monthly overview
Month-by-month expense tracking with comparison to previous periods, budget targets, and variance analysis.
Profitability analysis
Revenue vs. cost analysis per parcel, per crop, and per season — identifying the most and least profitable operations.
Filtering
Multi-dimensional filtering by time period, cost category, farm, and parcel for targeted financial analysis.
Expense table
Detailed expense table with sortable columns, inline editing, receipt attachments, and export functionality.
Fertigation and Crop Protection
Real-time monitoring of irrigation and fertilization parameters with crop protection management.
pH/EC monitoring with graphs and alarms
Real-time pH and electrical conductivity monitoring with historical graphs, trend analysis, and configurable threshold alarms.
Treatment records
Complete log of all crop protection treatments — product, dosage, application method, operator, weather conditions, and target pest/disease.
Waiting periods
Automatic calculation and tracking of pre-harvest intervals (PHI) after treatment applications, with alerts before safe harvest dates.
Disease catalog
Built-in catalog of common crop diseases and pests with identification guides, recommended treatments, and prevention strategies.
Inventory, Customers and Invoices
Integrated inventory management, CRM, and invoicing system for complete business operations.
Inventory with alerts
Real-time inventory tracking for materials, packaging, and products with configurable low-stock alerts and reorder suggestions.
CRM
Customer relationship management with contact details, purchase history, communication logs, and customer segmentation.
Invoice generation
Professional invoice creation with automatic calculations, tax handling, PDF export, and email delivery to customers.
Supplier management
Supplier database with contact information, product catalogs, price agreements, and purchase order history.
Dashboard and Reports
Central control panel with real-time overview and comprehensive reporting capabilities.
Control panel
Main dashboard with key performance indicators, alerts, recent activity feed, and quick-action shortcuts for daily operations.
Farm overview
At-a-glance view of all farms with status indicators, active parcels, current crop stages, and pending tasks.
CSV exports
One-click export of any data view to CSV format for external analysis, accounting integration, or regulatory reporting.
LOT traceability
End-to-end traceability reports from parcel and planting through harvest, packaging, and delivery — meeting food safety audit requirements.
Calendar with tasks
Interactive calendar displaying scheduled tasks, treatment windows, harvest plans, and deadlines with drag-and-drop rescheduling.
Technical Architecture
Enterprise-grade technical foundation supporting multi-tenant operations and robust security.
Multi-farm
Multi-tenant architecture allowing a single user to manage multiple farms with separate data, settings, and team members.
RBAC authorization
Role-based access control with granular permissions — owner, manager, worker, viewer — ensuring data security and appropriate access levels.
JWT authentication
Secure JSON Web Token authentication with refresh token rotation, session management, and automatic logout on inactivity.
Audit trail
Complete audit logging of all data modifications — who changed what, when, and previous values — for accountability and compliance.
Dark/light mode
Full dark and light theme support with system preference detection, reducing eye strain during early morning and late evening farm operations.
Tech stack
Technologies used and their role in the project.
React 18
Frontend framework for building interactive dashboards, forms, maps, and data visualizations.
TypeScript
Full-stack type safety ensuring reliable data handling across frontend and backend.
Node.js + Express
Backend REST API server handling authentication, business logic, and database operations.
PostgreSQL
Relational database for structured agricultural data, spatial queries, and complex reporting.
Prisma ORM
Type-safe database access layer with migrations, schema management, and query optimization.
Tailwind CSS + shadcn/ui
UI component library and utility-first styling for a consistent, accessible design system.
TanStack Query + Table
Server state management and advanced data tables with sorting, filtering, and pagination.
Recharts
Chart library for harvest trends, cost breakdowns, pH/EC graphs, and profitability visualizations.
Google Maps API
Interactive satellite maps for parcel drawing, visualization, and geospatial farm management.
Measurable results
Complete farm management coverage with 15+ integrated modules from parcel mapping to invoicing.
Google Maps satellite integration with parcel drawing, row generation, and cycle visualization.
Multi-tenant SaaS architecture supporting multiple farms, users, and crops with role-based access.
Over 10 chart types — donut, bar, line, area — for harvest, costs, fertigation, and profitability analysis.
What else we can implement
Beyond everything already built, here are additional features we can add to this type of project.
Mobile app
Native mobile application for field workers — harvest entry, task completion, and photo documentation directly from the field.
IoT sensors
Integration with soil moisture, temperature, and weather station sensors for automated data collection and real-time alerts.
AI recommendations
Machine learning-powered recommendations for optimal planting dates, irrigation schedules, and crop protection timing.
Marketplace module
B2B marketplace for direct farm-to-buyer sales with order management, pricing, and delivery coordination.
Multi-language
Internationalization support for Bosnian, English, German, and other languages to serve diverse farming communities.
Advanced analytics
Predictive analytics with yield forecasting, cost projections, and season-over-season performance benchmarking.
Ready for your project?
If you like what you see, contact us. Let's discuss your needs — no obligations.